Preserving Capital Through the Decline
July’s positive return followed a period in which QTES sustained substantially smaller losses than Bitcoin. Its year-to-date decline was less than one-third of Bitcoin’s, leaving more capital available to participate when markets recovered.
This balance between downside protection and participation in rising markets is central to performance across a full cycle. Smaller losses reduce the return needed to recover and allow subsequent gains to compound from a stronger capital base.
Participation in the Recovery
The +3.2% July return shows QTES participating as the market turned. The update also points to 2022 as an earlier example of capital protection: QTES declined 11.6%, while Bitcoin fell 64%. That earlier QTES result forms part of the simulated historical record, rather than the live trading period.
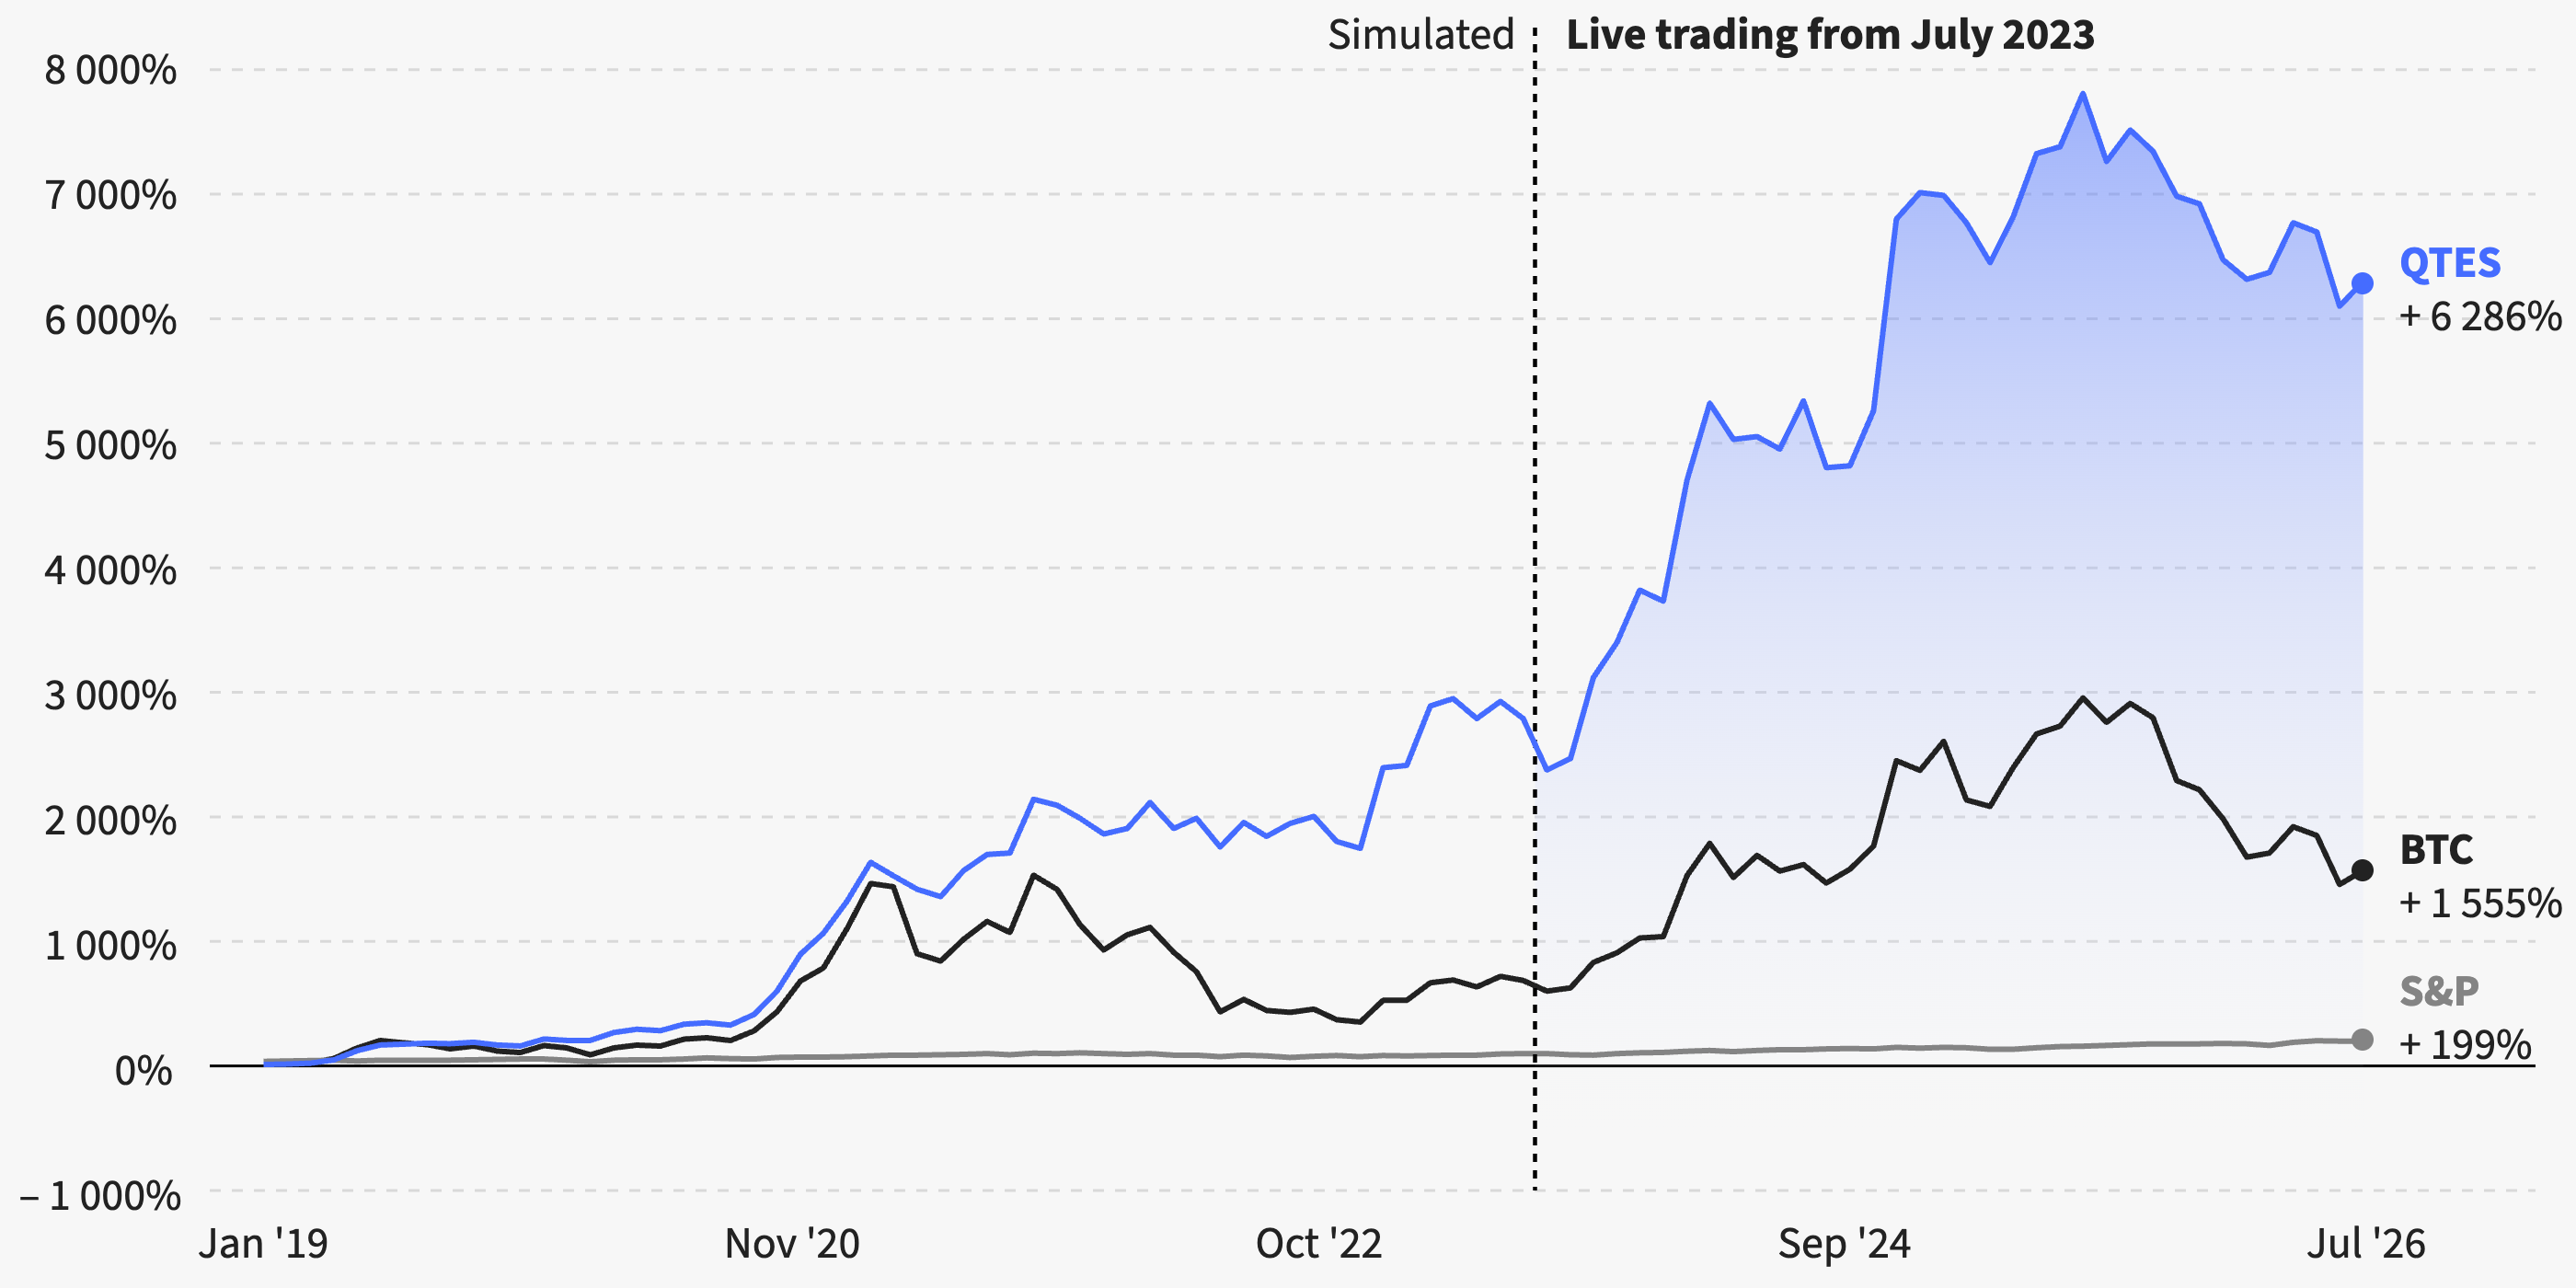
Performance Comparison
- July 2026 return. QTES +3.2%.
- 2026 year to date. QTES −8.9%, Bitcoin −28.2%.
- Cumulative return since 2019. QTES +6,286%, Bitcoin +1,555%, S&P 500 +199%.
- Average monthly return since inception. QTES +5.4%.
- Maximum drawdown since inception. QTES 21.6%, Bitcoin 73.1%.
- Sharpe and Sortino ratio. QTES 1.45 and 5.82.
Historical QTES figures combine simulated and live results, net of fees.
Long-Term Returns Relative to Risk
The update reports a cumulative QTES return of +6,286% since research inception in January 2019, compared with +1,555% for Bitcoin in the accompanying chart and +199% for the S&P 500. QTES’s average monthly return over the historical series was +5.4%.
Maximum drawdown was 21.6%, compared with 73.1% for Bitcoin. The reported Sharpe ratio of 1.45 and Sortino ratio of 5.82 provide additional measures of returns relative to risk across the combined simulated and live record.
July’s result adds a positive month to the portfolio’s recovery while retaining a substantial year-to-date performance advantage over Bitcoin.
Historical period note: the performance summary labels the cumulative return period January 2019 to June 2026, while the accompanying chart extends to July 2026 and shows the same +6,286% figure. The figures above are retained as reported.
Past performance, including simulated results, is not a reliable indicator of future returns.