Compounding from a Stronger Base
Bitcoin rebounded +25.0% in August, while QTES gained +16.2%. For the year to August, QTES remained ahead of Bitcoin: +5.9% versus −10.3%, a difference of 16.2 percentage points.
The significance lies in the capital available to compound. QTES entered the recovery with more capital intact after the preceding decline. August illustrates its objective of combining meaningful participation in rising markets with materially lower losses when the cycle turns.
+146% Since Live Trading Began
From July 2023 through August 2026, QTES generated a cumulative live return of +146%, net of fees, equivalent to growing each unit of starting capital to 2.46 times its original value.
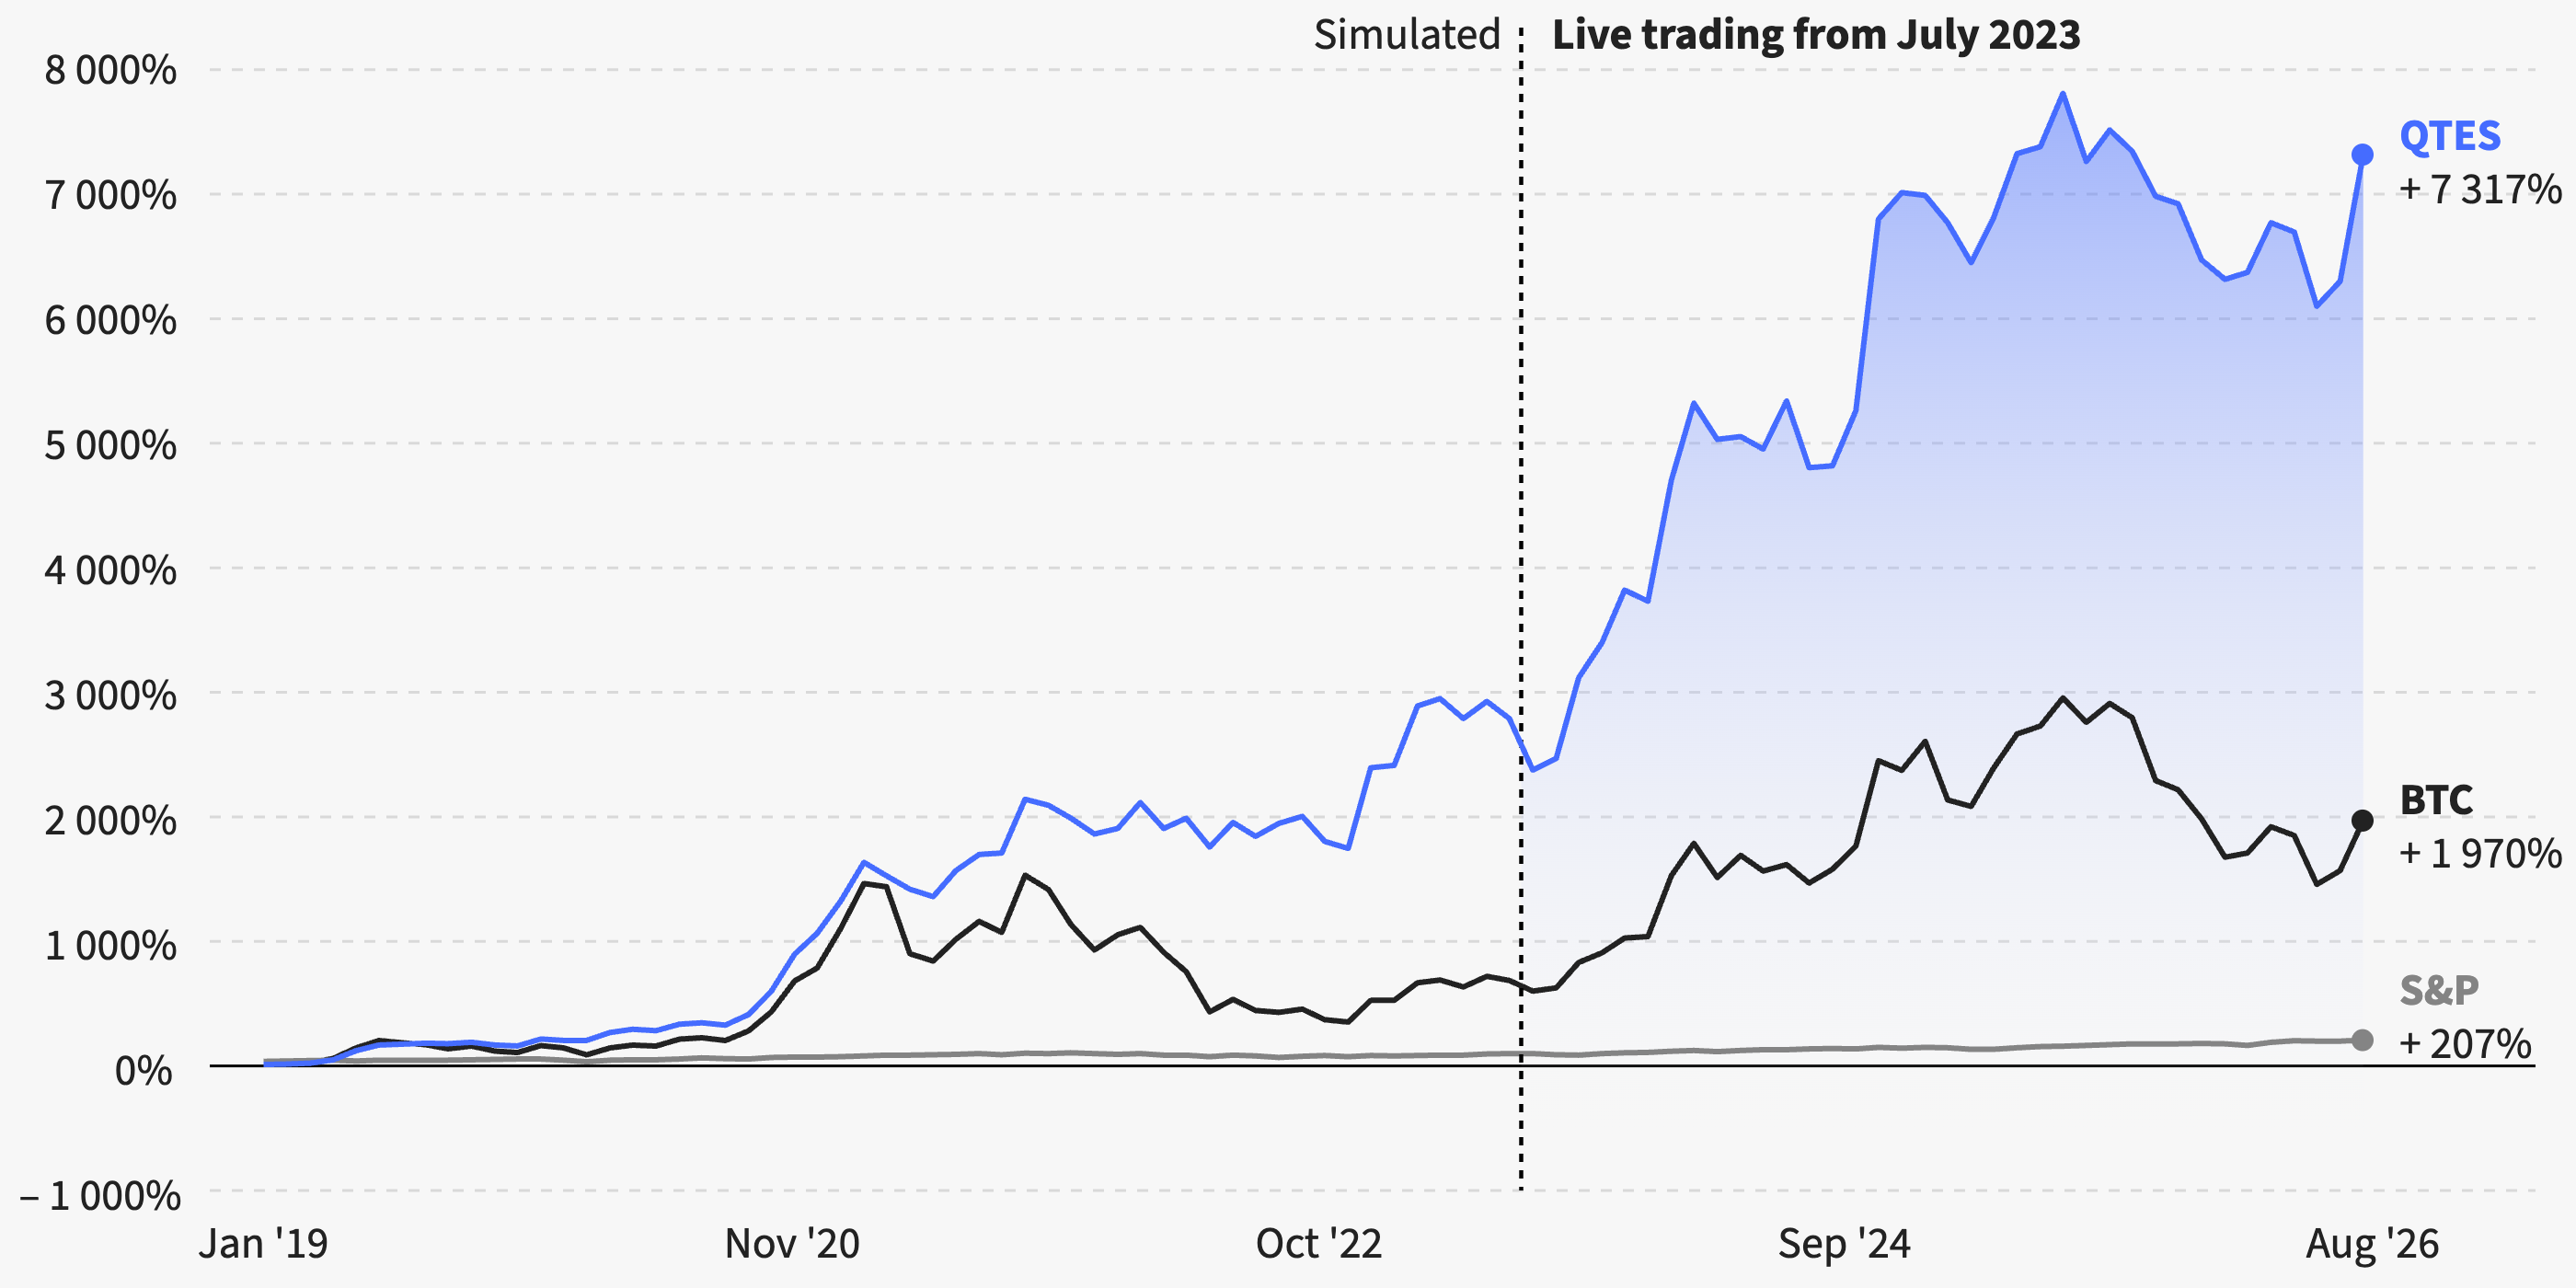
Performance Comparison
- August 2026. QTES +16.2%, S&P 500 +2.7%, Bitcoin +25.0%.
- 2026 year to date. QTES +5.9%, S&P 500 +12.5%, Bitcoin −10.3%.
- Cumulative return since January 2019. QTES +7,317%, S&P 500 +207%, Bitcoin +1,970%.
- Annualized return. QTES 75.4%, S&P 500 15.8%, Bitcoin 48.5%.
- Maximum drawdown. QTES 21.6%, S&P 500 24.8%, Bitcoin 73.1%.
- Sharpe ratio. QTES 1.48, S&P 500 0.97, Bitcoin 0.91.
- Sortino ratio. QTES 5.96, S&P 500 1.77, Bitcoin 2.19.
- Calmar ratio. QTES 3.48, S&P 500 0.64, Bitcoin 0.66.
Data through August 2026. Longer-term returns and risk metrics cover the historical period beginning in January 2019; QTES figures include simulated and live performance.
Long-Term Returns and Downside Protection
The historical series beginning in January 2019 recorded a cumulative QTES return of +7,317% and an annualized return of 75.4%. These figures combine simulated and live results and are distinct from the live trading record.
Over that period, QTES’s maximum drawdown was 21.6%, compared with 24.8% for the S&P 500 and 73.1% for Bitcoin. Its Sharpe ratio of 1.48 and Sortino ratio of 5.96 also exceeded both benchmarks, reflecting the relationship between returns and risk across the historical series.
Additional Returns from Execution Research
A separate live testing portfolio running alongside QTES reported an average +0.6% monthly incremental return, net of costs, from execution improvements. At the time of the August update, these improvements had not yet been promoted into the main production portfolio. The result is therefore separate from the QTES returns reported above.
Past performance, including simulated results, is not a reliable indicator of future returns.